
There are two core ways to forecast cash. The direct method projects the actual receipts and payments you expect, week by week. The indirect method starts from projected net income and adjusts for balance sheet changes. Use direct for the next 13 weeks, indirect for the next 12 months or longer, and update both on a rolling basis. The rest of this guide shows how each works, with numbers, and how to choose.
TL;DR
- Direct method: built from expected cash in and cash out. Best for daily to 13-week liquidity planning.
- Indirect method: built from forecast net income and balance sheet changes. Best for 3 to 12+ months and for lender-style projections.
- Most owners need both: a short direct forecast for payroll and bills, and a longer indirect view for strategy.
- Roll it forward: add a new week or month as each one closes, and model a base, optimistic and pessimistic case.
- Profit is not cash: timing of customer payments, payroll cycles and tax deadlines is what creates surprises.
Why the method matters
A profitable month can still leave you short on Friday. Sales you have booked but not collected do not pay anyone. That gap is what a forecast exists to show.
The stakes are real for small firms. One mid-2026 roundup reports that 51% of firms say their cash flows are uneven, and that roughly 22% hold fewer than six months of reserves. The Federal Reserve Bank of New York’s Small Business Credit Survey found that 86% of firms would need to cut expenses or find more funding if they lost two months of revenue.
The method you pick decides how far ahead you can see and how much work each update takes. So choose it by the question you need answered.
The direct method
The direct method models specific receipts and disbursements at the transaction level. Numeric’s 2026 guide describes it as estimating actual cash receipts and disbursements line by line. You are asking: who will pay me, when, and which bills do I have to pay that same week?
What goes into it
- Open invoices and their expected payment dates, based on how each customer really pays, not on the terms printed on the invoice.
- Signed contracts and recurring revenue.
- Payroll dates, payroll taxes, rent, loan payments, insurance premiums and vendor bills.
- Known one-offs: equipment, annual software renewals, quarterly estimated taxes.
A worked example
Take a Dallas HVAC contractor with $60,000 in cash on hand. In week one, it expects $28,000 in collections and has $31,000 in outflows (payroll $18,000, materials $9,000, rent and insurance $4,000). Closing cash is $57,000. In week two, a large commercial customer who usually pays in 45 days has not paid. Collections drop to $9,000 against $22,000 in outflows, so cash falls to $44,000. The owner sees the pinch early enough to push a vendor payment or call the customer.
| Week | Opening cash | Cash in | Cash out | Closing cash |
|---|---|---|---|---|
| 1 | $60,000 | $28,000 | $31,000 | $57,000 |
| 2 | $57,000 | $9,000 | $22,000 | $44,000 |
The illustration is simplified. The point is that every line is a real payment with a real date.
Accuracy
One 2026 analysis reports that the direct method reaches 8 to 12% mean absolute percentage error over 13 weeks, against 15 to 20% for indirect methods. Treat those figures as indicative, since results depend on the quality of your data. The direction is sensible, though: the closer you are to actual invoices and bills, the fewer assumptions you need.
Where it falls short
It gets harder to maintain the further out you go. Nobody knows which customers will pay in month nine. Past about 13 weeks, the direct method turns into guesswork with a lot of rows.
The indirect method
The indirect method works from your projected financial statements. You start with forecast net income, add back non-cash items such as depreciation, then adjust for changes in receivables, payables, inventory and debt. The result is a projected cash balance. This is the same logic as the operating section of a cash flow statement, run forward.
A worked example
Suppose a consulting firm forecasts next quarter’s net income at $90,000. It adds $6,000 of depreciation. Receivables are expected to grow by $40,000 because it is landing larger clients on net-60 terms. Payables are expected to rise by $10,000. The cash from operations is:
$90,000 + $6,000 − $40,000 + $10,000 = $66,000
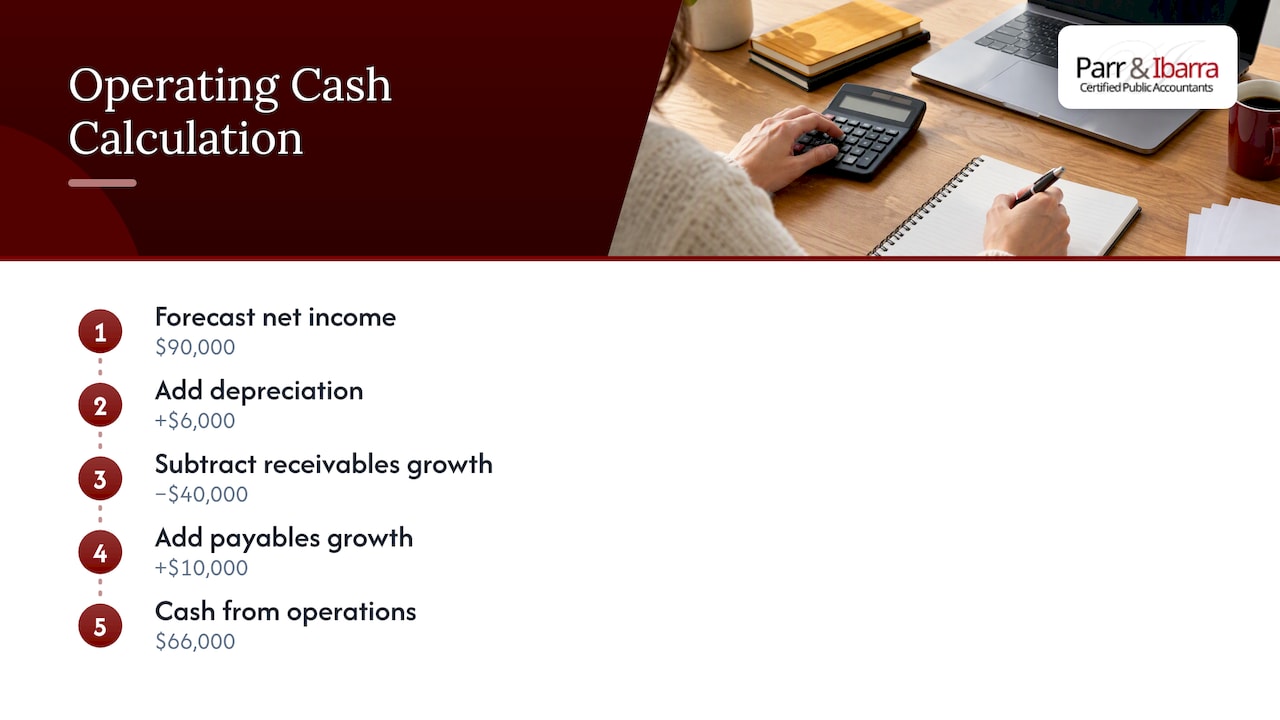
Profit says $90,000. Cash says $66,000. That $24,000 difference is growth tying up money in unpaid invoices.
Why it suits longer horizons
You already build a budget or income projection, so the indirect method reuses it. It scales to 12 months or more, and it shows how decisions such as hiring, buying inventory or taking on debt flow into cash. It also depends on accrual-based figures, so it helps to understand cash versus accrual accounting and which one your books follow.
Where it falls short
It hides timing. A quarter can look fine in total while one week in the middle is negative. It is only as good as the income projection beneath it, and that projection is often optimistic.
Direct vs. indirect at a glance
| Direct | Indirect | |
|---|---|---|
| Starting point | Expected receipts and payments | Forecast net income and balance sheet changes |
| Typical horizon | Daily to 13 weeks | 3 to 12+ months |
| Best question it answers | Can I make payroll on the 15th? | Can I fund growth next year? |
| Effort per update | Higher | Lower |
| Main weakness | Hard to extend far out | Hides short-term timing gaps |
Rolling forecasts: the method that makes both work
Static annual budgets go stale within weeks. A rolling forecast adds a new period each time one ends, so you always look the same distance ahead. Industry guidance cited in the research says that weekly rolling forecasts show 30 to 45% higher accuracy and surface liquidity gaps months earlier than static models. That is one analyst’s finding, so read it as a strong signal rather than a guarantee.
A practical setup:
- Keep a 13-week direct forecast. Update it every week with actual bank balances.
- Keep a 12-month indirect forecast. Update it monthly after the books close.
- Compare forecast to actual each time, and note why the variance happened. That habit improves the next forecast more than any software does.
Budgets and forecasts are different tools. NAIOP’s 2026 piece notes that budgets tend to be static while forecasts are updated continuously as real performance comes in. We cover the monthly side in our post on monthly forecasts for small business CFOs.
Other methods you will see
Guides also describe forecasting by data source rather than by structure.
- Top-down: start from a market or revenue target and work down to cash. Fast, but weak on detail.
- Bottom-up: build from individual customers, contracts and costs. More work, more reliable.
- Statistical or driver-based: use historical patterns, seasonality or operational drivers such as jobs booked or units shipped. Useful when you have a few years of clean data.
These are ways of generating the numbers. You still choose direct or indirect for the layout. For product businesses, the inventory side matters a lot, and our guide to inventory accounting methods explains how your costing choice changes reported numbers.
Build a 12-month forecast step by step
- Clean the books first. A forecast built on three months of unreconciled transactions is fiction. If your records are behind, start with our bookkeeping guide for small business owners.
- Set your starting cash from reconciled bank balances.
- Forecast revenue by timing of collection, not by month of sale. Use your actual average days to collect.
- Map fixed and lumpy costs. Insurance premiums, annual licenses, and payroll that falls on a three-paycheck month all belong in the right week. The Illinois SBDC’s cash guide points out that companies can be profitable and still cash-negative, and warns against flat-lining revenue instead of mapping timing. With biweekly pay, two months a year have three payrolls.
- Add taxes on their due dates. Federal estimated payments are quarterly. See our explainer on estimated quarterly taxes and set up a small business tax calendar so those dates show up in the forecast.
- Add financing and capital spending: loan principal, equipment, owner draws.
- Run three scenarios. Model a base case, an optimistic case and a pessimistic one. NAIOP’s article cites modeling a 15 to 20% revenue shortfall as standard practice.
- Set a trigger. Decide in advance what you will do if cash falls below a floor, such as delaying a hire or drawing on a line of credit.
Forecasting for lenders is a different document
The forecast you run weekly is not the one a bank wants. One 2026 explainer says that lenders expect 12 to 24 months of projections tied to documented assumptions, with a clear line between signed and speculative revenue. A downside case, often a 15 to 20% revenue miss, shows the business can still service its debt.
If financing is on your horizon, it helps to understand lender cash flow requirements before you build the model. Keep the internal version and the lender version separate, and make sure they reconcile.
Special cases
Nonprofits. Cash timing often follows reimbursement-based contracts, billing cycles and seasonal program income, as these nonprofit cash management slides outline. A direct forecast by funding source usually works best.
Owners who pay their own taxes. The set-aside percentage is a cash tool, not a tax calculation. That distinction is explained in this write-up on estimated taxes. Put the set-aside in your forecast as a real outflow, and let your CPA set the actual quarterly amounts.
Real estate investors. Cash timing shifts with leases, capital expenditure and depreciation strategy. A cost segregation study can change the tax cash you pay in a given year, so it belongs in the scenario planning, not an afterthought.
Our perspective
Most of the owners we meet in Dallas-Fort Worth do not have a forecasting problem. They have a timing problem that nobody has written down. The books are a few months behind, payroll runs on a schedule nobody mapped, and tax payments arrive as a surprise.
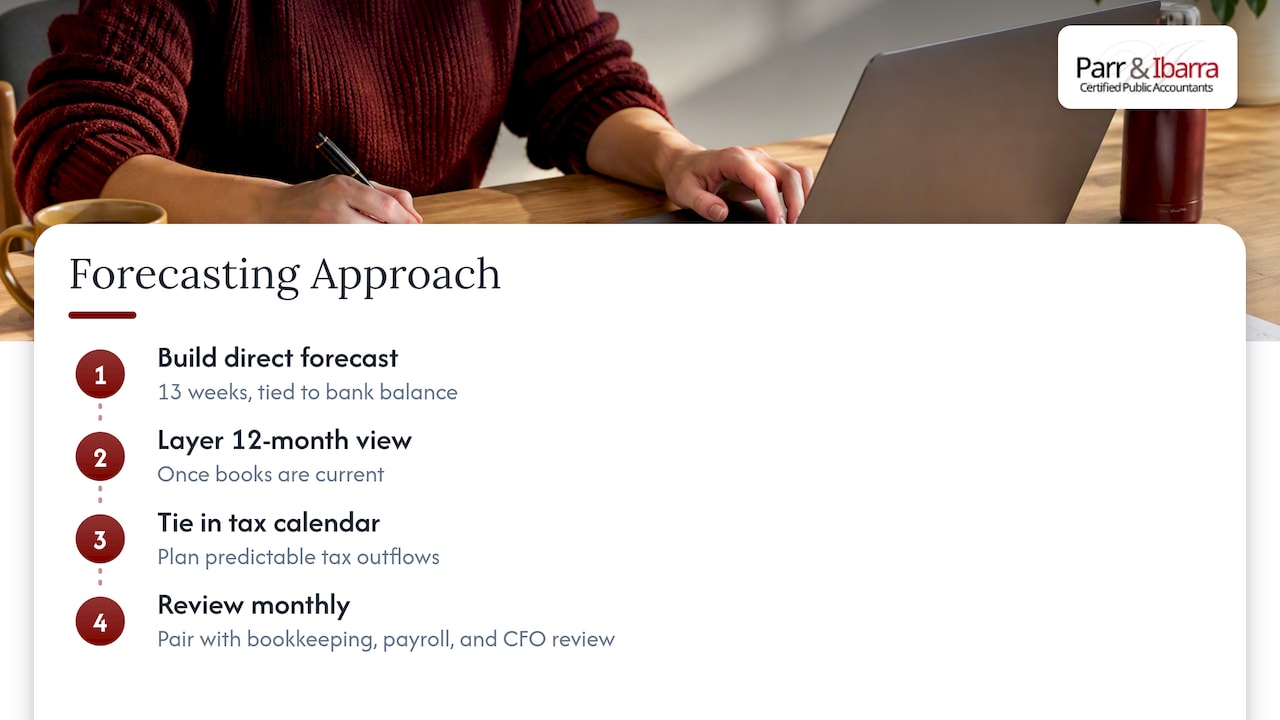
So we start with the simplest forecast that answers the next question. Usually that is a 13-week direct forecast tied to the bank balance, then a 12-month view layered on top once the books are current. We tie the tax calendar to it, because tax timing is the most predictable outflow most owners fail to plan for.
The forecast is also not an annual event. It is a monthly conversation about what changed, what it means for cash, and what to do before the gap opens. That is why we pair it with bookkeeping, payroll and CFO-level review rather than treating it as a one-off spreadsheet.
— Adan
Getting help with your forecast
If you want a forecast that stays current, our team can build it alongside your books and tax plan. See our outsourced CFO and comptroller services and our financial planning and analysis work. We serve individuals, business owners, nonprofits and real estate investors across Dallas-Fort Worth, in English and Spanish.
FAQ
What is the difference between direct and indirect cash flow forecasting?
The direct method projects actual cash receipts and payments, so it is precise over the short term. The indirect method starts with forecast net income and adjusts for non-cash items and balance sheet changes, so it suits longer planning. Many businesses use direct for 13 weeks and indirect for the year.
How far ahead should a small business forecast cash?
A 13-week forecast covers day-to-day liquidity, and a 12-month forecast covers planning and budgeting. If you are applying for a loan, expect to need 12 to 24 months with documented assumptions. Update both on a rolling basis.
How often should I update a cash flow forecast?
Update the short-term direct forecast weekly with actual bank balances. Update the longer indirect forecast monthly once the books close. Always compare forecast with actual to see where your assumptions were wrong.
Is a cash flow forecast the same as a budget?
No. A budget is a plan you set once and adjust occasionally. A forecast is updated continuously with real results, and it focuses on when cash actually moves rather than on what you intended to spend.
Sources
- Cash flow forecasting whitepaper, MCP Analytics
- Small Business Cash Flow Statistics (2026), The Broker Shop
- Small Business Credit Survey, Federal Reserve Bank of New York
- Cash Flow Forecasting In 2026, Numeric
- Forecasting the Future, NAIOP
- Managing Cash, Illinois SBDC
- SBA loan cash flow forecast, Finoya
- Cash Flow Management slides, nonprofitfinancials.org
- Quarterly estimated taxes write-up, Forvendo

